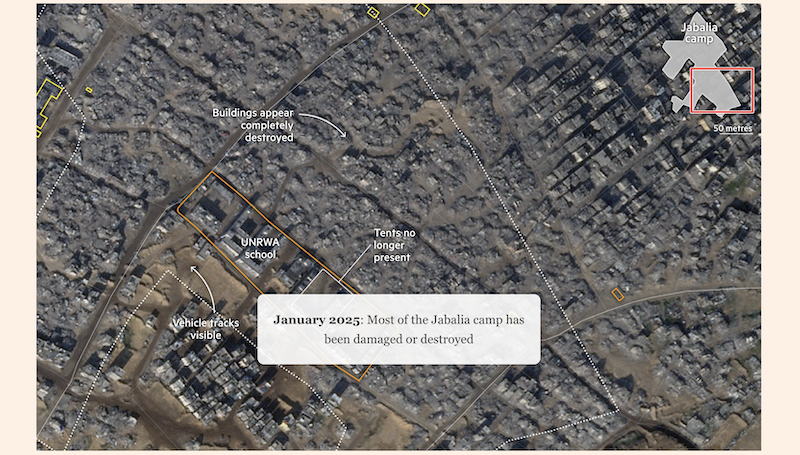
Golan Heights trenches
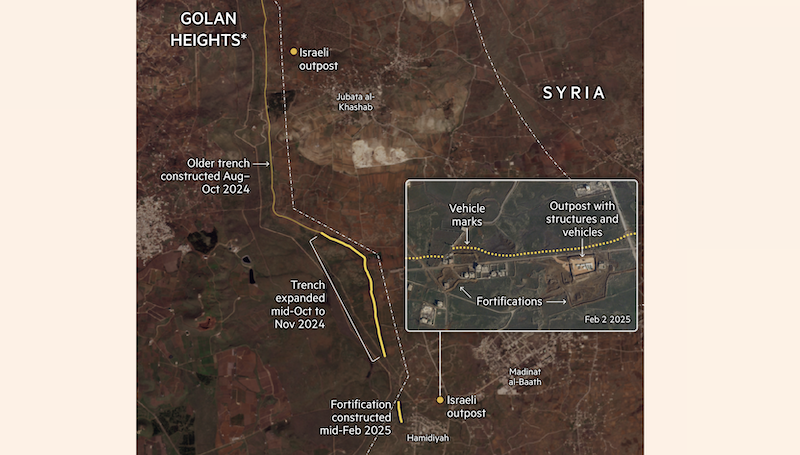
Analysed satellite images and collaborated with foreign correspondents to verify and supplement on-the-ground reporting on Israeli incursions into the Golan Heights and southern Syria. Identified new trenches, fortifications and outposts and produced two maps on a breaking news analysis timeline.